PlayerInsight
PlayerInsight is a comprehensive analytics tool that comes automatically when you use PlayerIO with your game.
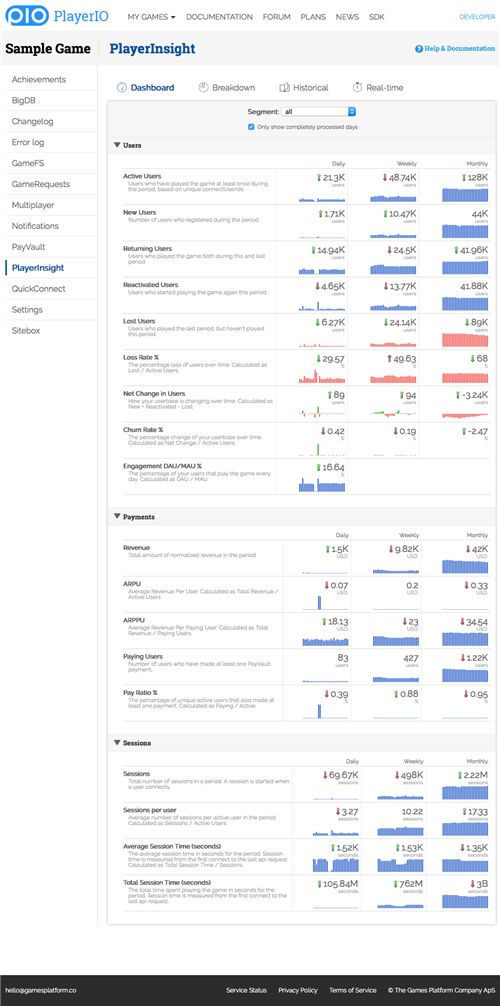
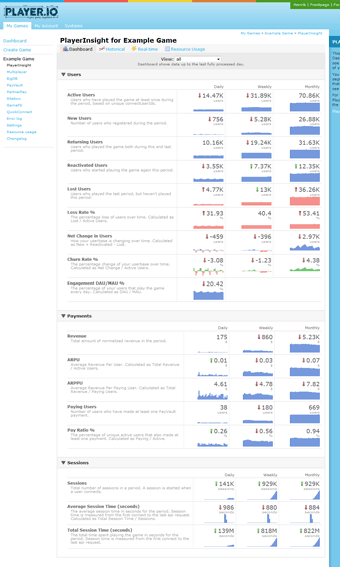
Dashboard
The Dashboard page is where you can see the most important metrics of your game at a glance. You can switch between different segments to view metrics for that segment, or choose 'all' to see global metrics.
To be able to see the revenue metrics you need to have completed the revenue normalization setup for your game.
Historical Stats
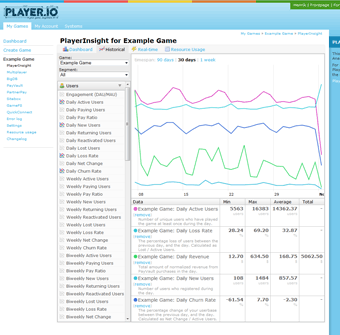
The Historical Stats page allows you to really dive into all the statistics collected through the system.
Here you can view all the various stats, for example Daily Active Users, Churn Rate, or API traffic used.
You can compare the numbers across games, and across segments, so you can for example compare the Average Revenue Per User for all Facebook users in one game with the ARPU for all Simple users in another game.
To be able to see the revenue metrics you need to have completed the revenue normalization setup for your game.
Real-time Stats
The Real-time Stats page allows you to view and compare all the real-time statistics that are collected through the system.
Here you can see events happen the second they happen, for example user connects, PayVault transactions, or Multiplayer rooms created. You can also view your current online user number.
Just like the Historical Stats, you can compare numbers across different games, but the set of collected statistics is slightly different from what's available per day, and there are no segments. All real-time stats are global for each game.
Resource Usage
Finally, you can view the game's Resource Usage table. This page basically shows the Historical stats in table format.
These numbers are used when calculating your game's usage bill, and are shown here so you can check and cross-reference.
Segments
Segments are a way to group and compare different sets of users to each other. By default, users are segmented based on QuickConnect, which means you can very easily compare for example Facebook users against Simple users, and see how they differ in engagement, average session time, ARPU, or similar.
All users are always part of the global 'all' segment that you can use to view your entire userbase.
Also, all statistics collected aren't segmented. This typically applies to other statistics like Multiplayer rooms created, GameFS file size, or API network traffic, and these stats can only be viewed by selecting the 'all' segment.
Active Users
PlayerInsight tracks all unique active users for each day, and which segments they are in. This allows us to calculate user movement over time. For daily stats we look at the user activity in that day and compare to the previous day. For weekly stats we look at 7 days of activity and compare to the 7 days before those. And for monthly stats we look at 30 days of user activity and compare to the 30 days before those.
- Active users: The users that were active in the period.
- New users: The users that registered during the period, and therefore haven't been active previously.
- Returning users: The users that were active both in this period and in the last. These are your core users that come back day after day, or month after month.
- Reactivated users: The users that were active this period, but not in the last period. They stopped playing, but for some reason they're back again.
- Lost Users: The users that were active last period, but not in this period. These users have stopped playing, but might return later.
- Loss Rate: This number reflects how large a percentage of your userbase left in the last period.
- Net Change: The difference in amount of users between this period and the last. If this number is positive, your userbase is growing day by day or month by month.
- Churn rate: The percentage change of your userbase from period to period. This number reflects the rate of growth in your game.
- Engagement: The number of Daily Active Users divided by Monthly Active Users gives you the engagement factor. The higher this number is, the more people play your game every day, instead of just occasionally.
Revenue
In order to show aggregated revenue statistics, you can configure revenue normalization in your PayVault configuration. You do this by entering a target currency, and exchange rates towards that currency from all other currencies that you receive PayVault revenue in. When you change the configuration, all numbers and graphs that depend on it will automatically and dynamically change.
- Revenue: This is the main revenue number and is simply a sum of all your revenue in the period, converted to the target currency you picked when you set up the normalization. For example, if your target currency is USD, then this and all of the following stats will be in US Dollars.
- ARPU: Average Revenue Per User is exactly what it says. The total revenue for the period divided by the total number of active users in the period gives you the average.
- ARPPU: Average Revenue Per Paying User is also exactly what it says, but calculated through the number of paying users in a period instead of the total active.
- eRPM: Effective Revenue Per Mille is a number that allows you to compare the monetization of your game to advertising, which normally uses CPM. This number is simply calculated as your total revenue divided by how many thousands of sessions there were in the period.
- Paying Users: The users that were active and made at least one payment in the period.
- Pay Ratio: The percentage of your users that made at least one payment in the period.
Sessions
PlayerInsight also tracks all unique sessions played in your game. Every time a user performs a call to Authenticate, a new session starts. The time of each session is also measured, and a session is kept alive each time the user either performs an Backend Service request, or by the user staying connected to a Multiplayer room.
A user can be in several sessions simultaneously, so for example if you have a browser-based game and the same user opens it in two browser tabs, that will count as two simultaneous connections. But if this example user instead only has one window with the game and reloads it, which causes it to re-connect, that will count as two consecutive sessions, with the first ending just as the second one starts.
Tracking sessions allows us to present the following data:
- Sessions: The total number of unique sessions that started in the period. A session that runs across midnight will still only be counted once, for the day it was started.
- Total Session Time: The total amount of time spent by your users, for the sessions started in the period. If a session spans midnight, the session time will added to the total of the day it started, it will not be split up into multiple days.
- Average Session Time: The average is simply the time spent divided by the number of sessions. This gives you an indication on how long users stay in your game before moving on.